Monitoring and Alerts
Metrics
Penfield provides metrics using the Prometheus Data Model. You can use Prometheus or any scraping tool which supports that data model to pull metrics data from penfield for further monitoring and analysis.
Logging
Penfield logs important events and errors for troubleshooting and analysis. Logs can be streamed to a centralized logging system for easy monitoring.
Monitoring
Monitoring of the environment can be set up using open-source tools like Grafana. Prometheus can be configured to scrape metrics from the project, which can then be visualized and analyzed in Grafana dashboards.
Alerting
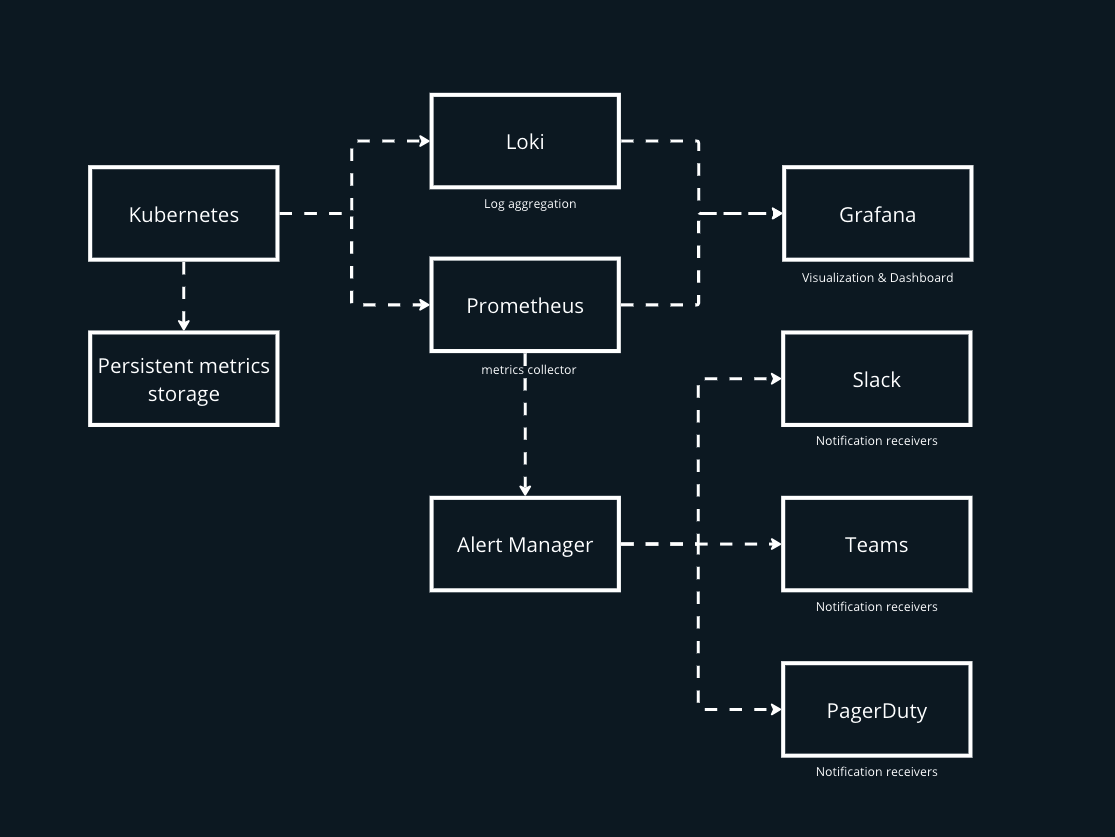
Alerts can be configured to notify users of critical events or issues. This can be achieved using integrations with tools like Teams, slack or PagerDuty. Alerts can be set up based on thresholds or specific conditions, ensuring timely response to issues.
Here is the high level architecture how monitoring and alerting can be setup: